What you get
Summary — before → after
The numbers shown are anonymised; the workflow is real.
Option 1 — Word

Option 2 — Word
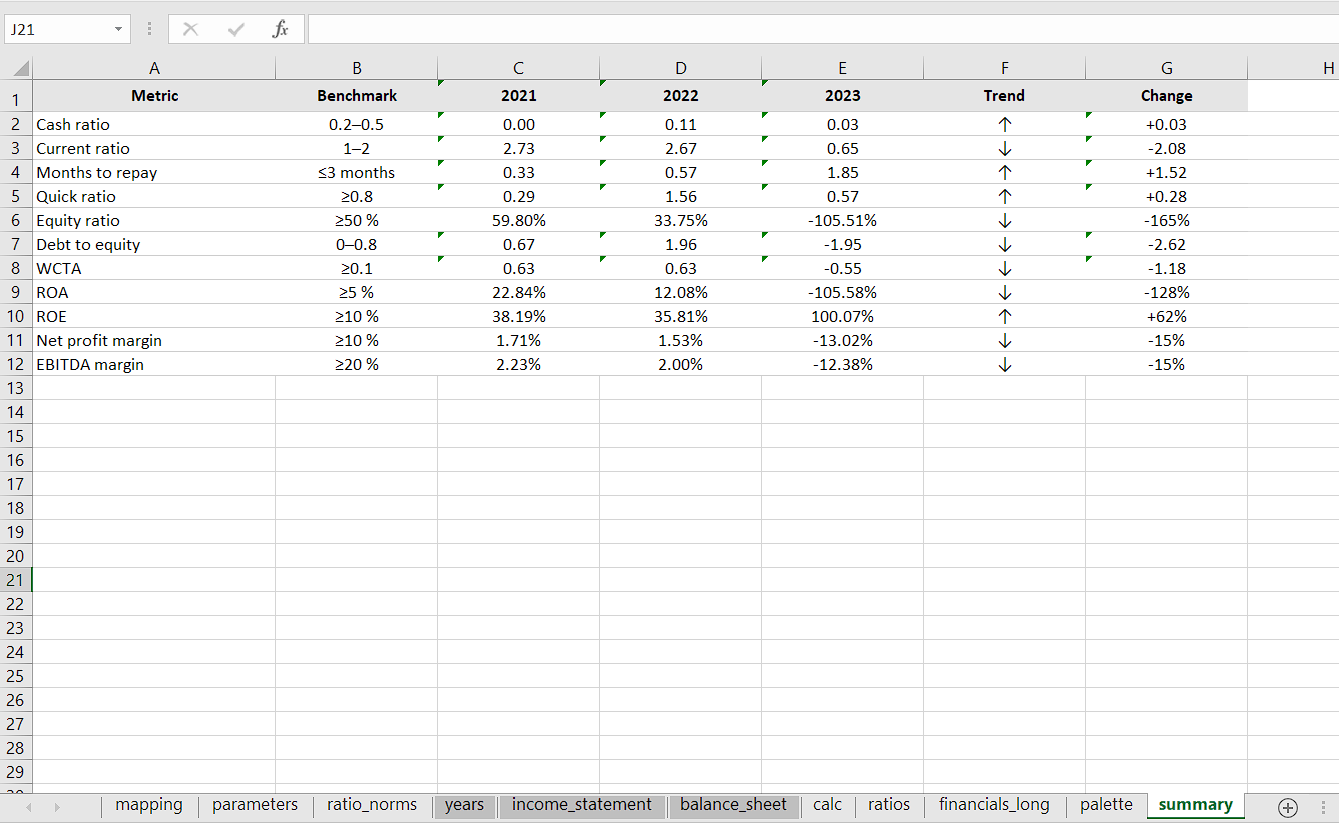
Automation that rebuilds the Excel Summary (12 KPIs) and generates a Word report section — deterministic, repeatable output every run
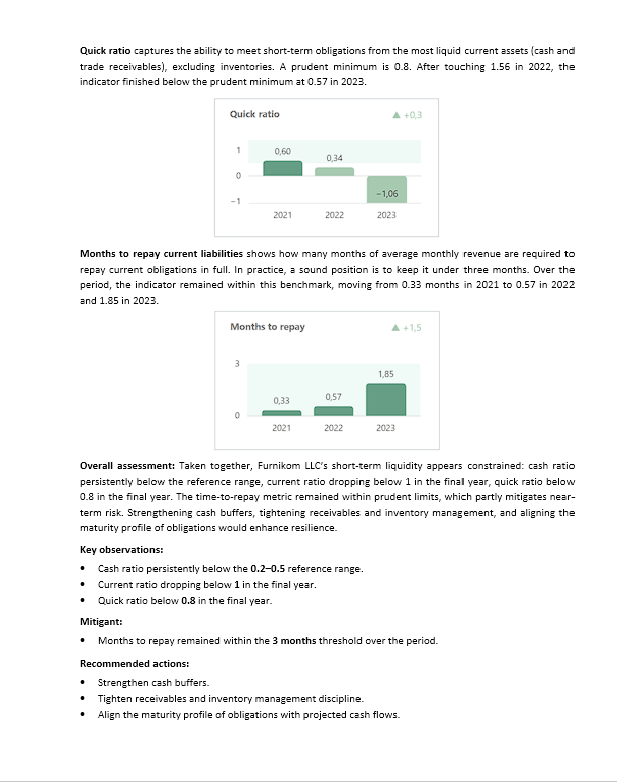
This isn’t a demo or a bundle of screenshots. It’s a Python routine that runs from an Excel workbook: using the supplied inputs, the Summary sheet compiles a table of twelve key ratios over three years; trends are calculated, the latest period is set against the first, and each result is checked against its norm. The script then produces a Word report in a standard financial-analysis layout – a tidy table with norms, brief notes on movements and a clear conclusion. What’s shown here is a small public excerpt from a much deeper analysis, shared to convey the method and standard of the work.
Deterministic outputs • Templated Word report section • Defensive KPI rules • Drop‑in reuse across datasets
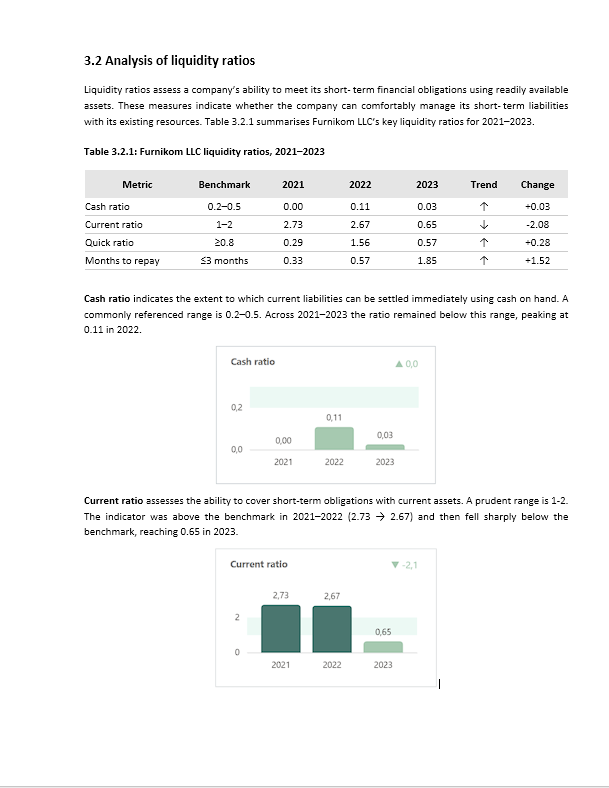
Why Word v2? For the portfolio we embed clean charts captured from the companion Power BI dashboard (Page 2 — v2, flat/print).
For a similar interpretation in Power BI — interactive dashboarding and print‑friendly report visuals from the same dataset — see: live page · repository
The numbers shown are anonymised; the workflow is real.
          cd run
          python -m venv .venv
          # Windows:
          .venv\Scripts\activate
          # macOS/Linux:
          source .venv/bin/activate
          # Install & run:
          pip install -r ../requirements.txt
          python summary.py
Result: the workbook in run/ gets its Summary sheet rebuilt, and the file analysis_of_liquidity_ratios.docx appears in run/.
This portfolio case uses anonymised sample data. No client-identifying information is included.
Connect on LinkedIn, explore projects on GitHub, or send an email